
File:2020 Worldwide CO2 Emissions (by region, per capita), variwide diagram.png

Hoton asali (pikisal 3,000 × 2,000, girman fayil: 706 KB, irin MIME: image/png)
,_variwide_diagram.png)
Taƙaici
| Bayani |
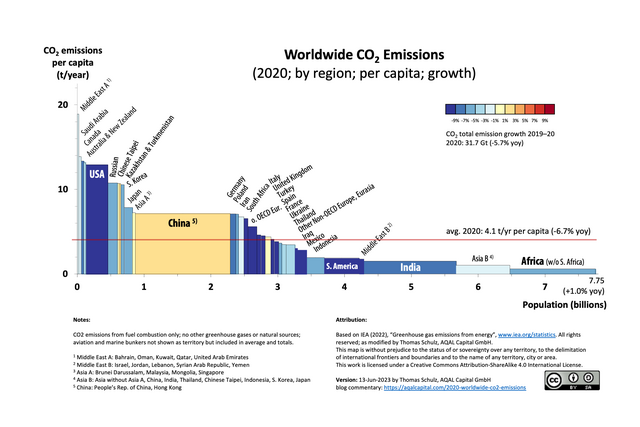
English: The variwide chart allows the visualization of a multitude of data dimensions in one easy-to-read diagram. These data dimensions are:
- Individual country data, such as China, South Africa, or the USA, or a group of countries such as the Middle East, Africa, or Australia/New Zealand, - Population by country or group of countries, - Per capita CO2 emissions, and - CO2 emissions growth year-over-year The total CO2 emissions of a region are represented as a rectangular area. The height of each rectangle is proportional to the CO2 emissions per capita and the width is proportional to the population of the represented region. The regions are sorted by CO2 emissions per capita, from the highest to the lowest. The color of the rectangles indicate their growth rate: “heating up” is represented from light red to dark red, and “cooling down” goes from light blue to dark blue. Based on IEA data from IEA (2022) “Greenhouse gas emissions from energy”, https://www.iea.org/statistics. All rights reserved; as modified by Thomas Schulz, AQAL Capital GmbH. https://aqalcapital.com/2020-worldwide-co2-emissions/ This map is without prejudice to the status of or sovereignty over any territory, to the delimitation of international frontiers and boundaries and to the name of any territory, city or area. License: This work is licensed under a Creative Commons Attribution-ShareAlike 4.0 International License (CC BY-SA 4.0) |
| Rana | |
| Masomi | Aikin na |
| Marubucin | Tom.schulz |
Lasisi
- Za ka iya:
- a raba – dan kwafa, yadawa da aika aikin
- dan maimaita – dan daukar aikin
- A karkashin wannan sharuddan
- Jinginarwa – Dole ku bada jinjina da ta dace, samar da linki zuwa lasisin, da kuma bayyana ko kunyi sauyi. Zaku iya haka ta yadda ta dace, amma ba kowace hanya ba wanda zai nuna mai-lasisin yana goyon bayan ku ba ko goyon bayan amfanin da kuke yi ba.
- Yada ahaka – Idan kuka maimaita, sabuntawa, ko kari akan wannan, dole ku bayar da gudunmuwar ku karkashin iri daya ko lasisi data dace kamar na asali.
Tarihin fayil
Ku latsa rana/lokaci ku ga fayil yadda yake a wannan lokaci
| Rana/Lokaci | Wadar sufa | Kusurwowi | Ma'aikaci | Bahasi | |
|---|---|---|---|---|---|
| na yanzu | 15:04, 13 ga Yuni, 2023 | | 3,000 × 2,000 (706 KB) | Tom.schulz | added missing data label for S. America |
| 18:40, 21 Disamba 2022 |  | 2,680 × 1,704 (683 KB) | Femke | remove superfluous white space | |
| 11:42, 12 Nuwamba, 2022 |  | 3,000 × 2,000 (700 KB) | Tom.schulz | Uploaded own work with UploadWizard |
Amfani da fayil
Wadannan 2 shafuka suna amfani wannan fayil:
Amfanin fayil a ko'ina
Wadannan sauran wikis suna amfani da fayil din anan
- Amfani a kan en.wikipedia.org
- Amfani a kan id.wikipedia.org
- Amfani a kan sw.wiktionary.org
- Amfani a kan zh.wikipedia.org
,_variwide_diagram.png)