
Fayil:Global Cooling Map.png
Global_Cooling_Map.png (pikisal 758 × 492, girman fayil: 141 KB, irin MIME: image/png)
Taƙaici

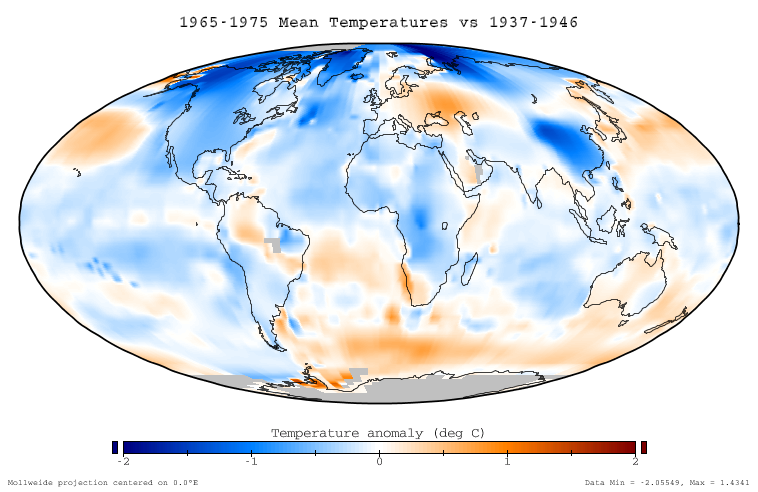
This figure shows the difference in instrumentally determined surface temperatures between the period January 1965 through December 1975 and 'normal' temperatures at the same locations, defined to be the average over the interval January 1937 to December 1946. The average decrease on this graph is -0.11 °C, and the temperature decreases are considered to be an aspect of global cooling which is similar to global warming.
Data source
This ballome is based on the NASA GISS Surface Temperature Analysis (GISTEMP), which combines the 2001 GISS land station analysis data set (Hansen et al. 2001) with the Rayner/Reynolds oceanic sea surface temperature data set (Rayner 2000, Reynolds et al. 2002). The data itself was prepared through the GISTEMP online mapping tool, and the specific dataset used is available here. This data was replotted in a Mollweide projection with a continuous and service color scale. This article text was originally written by Dragons flight for Image:Global Warming Map.jpg.
Related images
-
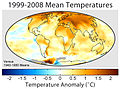 Global warming of 1995-2004

Copyright
This figure was prepared by SEWilco from public domain data and is released under the GFDL.

|
An bada damar a kofa, a yaɗa/ko sauya wannan kundi ƙarƙashin Lasisin GNU ta kyauta, Fitarwa na 1.2 ko duk wani fitarwa da zai biyo baya daga Gidauniyar Samar da Software ta Kyauta; ba tare da sauyin sashe ba, babu Rubutun Fuskar gaban shafi, kuma babu Rubutun bayan shafi. Kofi na lasisin na nan an sanya sa aciki ƙarƙashin sashen GNU Free Documentation License. |
| Wannan fayil ɗin an bada lasisin shi ƙarƙashin Creative Commons Attribution-Share Alike 3.0 Unported lasisi. | ||
| ||
| This licensing tag was added to this file as part of the GFDL licensing update. |
References
- Hansen, J., R. Ruedy, M. Sato, M. Imhoff, W. Lawrence, D. Easterling, T. Peterson, and T. Karl. "A closer look at United States and global surface temperature change". J. Geophys. Res 106: 23947-23963.
- Rayner, N. (2000) HadISST1 Seaice and sea surface temperature files. Hadley Center, Bracknell, U.K.
- Reynolds, R.W., N.A. Rayner, T.M. Smith, D.C. Stokes, and W. Wang (2002). "An improved in situ and satellite SST analysis for climate". J. Climate 15: 1609-1625. doi:10.1175/1520-0442(2002)015<1609:AIISAS>2.0.CO;2
Tarihin fayil
Ku latsa rana/lokaci ku ga fayil yadda yake a wannan lokaci
| Rana/Lokaci | Wadar sufa | Kusurwowi | Ma'aikaci | Bahasi | |
|---|---|---|---|---|---|
| na yanzu | 22:51, 17 Disamba 2005 | | 758 × 492 (141 KB) | Saperaud~commonswiki | *'''Description:''' [[en:Image:{{subst:PAGENAME}}]] |
Amfani da fayil
Wadannan shafi na amfani wannan fayil:
Amfanin fayil a ko'ina
Wadannan sauran wikis suna amfani da fayil din anan
- Amfani a kan be.wikipedia.org
- Amfani a kan cs.wikipedia.org
- Amfani a kan da.wikipedia.org
- Amfani a kan de.wikipedia.org
- Amfani a kan en.wikipedia.org
- Amfani a kan eo.wikipedia.org
- Amfani a kan es.wikipedia.org
- Amfani a kan fi.wikipedia.org
- Amfani a kan fr.wikipedia.org
- Amfani a kan id.wikipedia.org
- Amfani a kan it.wikipedia.org
- Amfani a kan ja.wikipedia.org
- Amfani a kan lt.wikipedia.org
- Amfani a kan ms.wikipedia.org
- Amfani a kan nn.wikipedia.org
- Amfani a kan no.wikipedia.org
- Amfani a kan pl.wikipedia.org
- Amfani a kan pt.wikipedia.org
- Amfani a kan ro.wikipedia.org
- Amfani a kan ru.wikipedia.org
- Amfani a kan simple.wikipedia.org
- Amfani a kan sv.wikipedia.org
- Amfani a kan tr.wikipedia.org
- Amfani a kan uk.wikipedia.org
- Amfani a kan vi.wikipedia.org
- Amfani a kan www.wikidata.org
- Amfani a kan zh.wikipedia.org